
Caseload statistics
We track statistics on the number of appeals we handle at the Social Security Tribunal (SST).
Our yearly reports show a breakdown of the statistics by division and include:
- inventory at the start of the year
- number of appeals received during the year
- number of appeals concluded during the year
- inventory at the end of the year
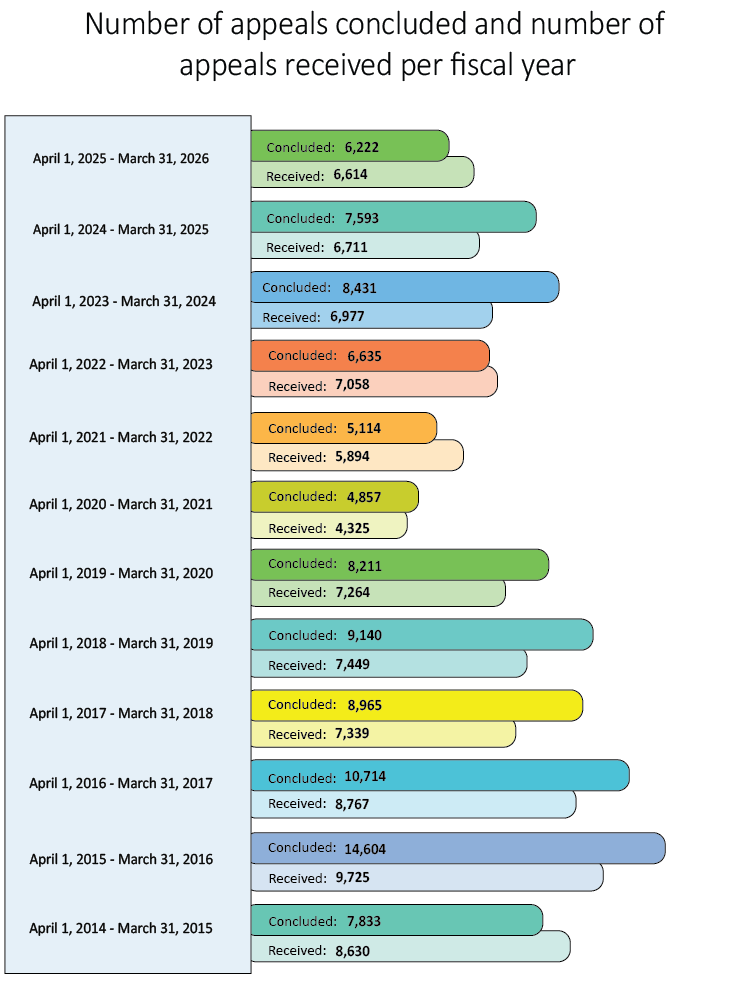
Number of appeals concluded and received during each fiscal year.
- April 1, 2025 to March 31, 2026 Concluded 6,222, Received 6,614
- April 1, 2024 to March 31, 2025 Concluded 7,593, Received 6,711
- April 1, 2023 to March 31, 2024 Concluded 8,431, Received 6,977
- April 1, 2022 to March 31, 2023 Concluded 6,635, Received 7,058
- April 1, 2021 to March 31, 2022 Concluded 5,114, Received 5,894
- April 1, 2020 to March 31, 2021 Concluded 4,857, Received 4,325
- April 1, 2019 to March 31, 2020 Concluded 8,211, Received 7,264
- April 1, 2018 to March 31, 2019 Concluded 9,140, Received 7,449
- April 1, 2017 to March 31, 2018 Concluded 8,965, Received 7,339
- April 1, 2016 to March 31, 2017 Concluded 10,714, Received 8,767
- April 1, 2015 to March 31, 2016 Concluded 14,604, Received 9,725
- April 1, 2014 to March 31, 2015 Concluded 7,833, Received 8,630